
McKinsey & Co
Homepage features, MGI exhibits, and mobile app iconography for McKinsey.com
Overview:
Editorial visuals and data-viz created for McKinsey Global Institute publications and related tools—designed to make dense research legible at a glance and consistent with McKinsey’s visual language.


Homepage Features
Editorial hero graphics for McKinsey Global Institute publications produced as front-page visuals on McKinsey.com.
McKinsey: Infrastructure
Slide series translating long-range infrastructure forecasts into clear exhibits built for fast reading in presentations.


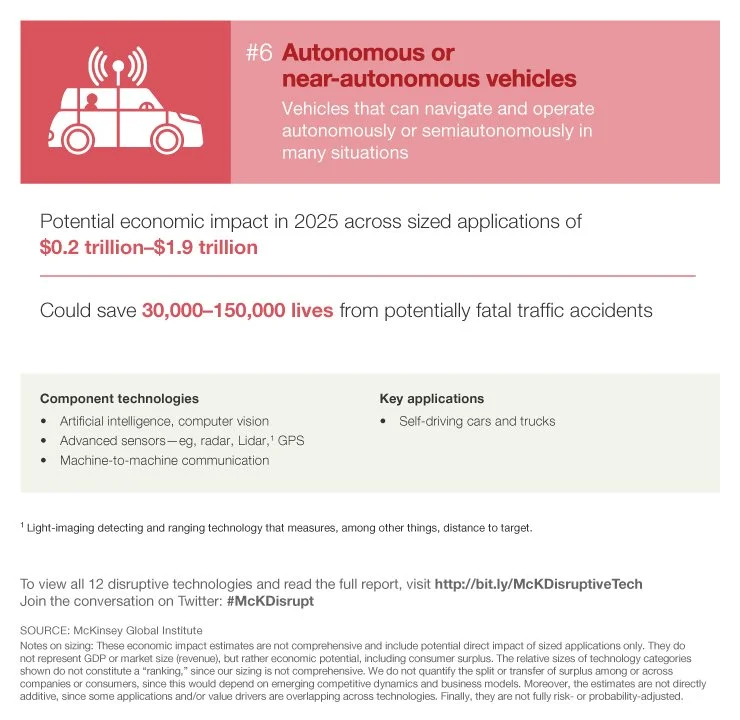
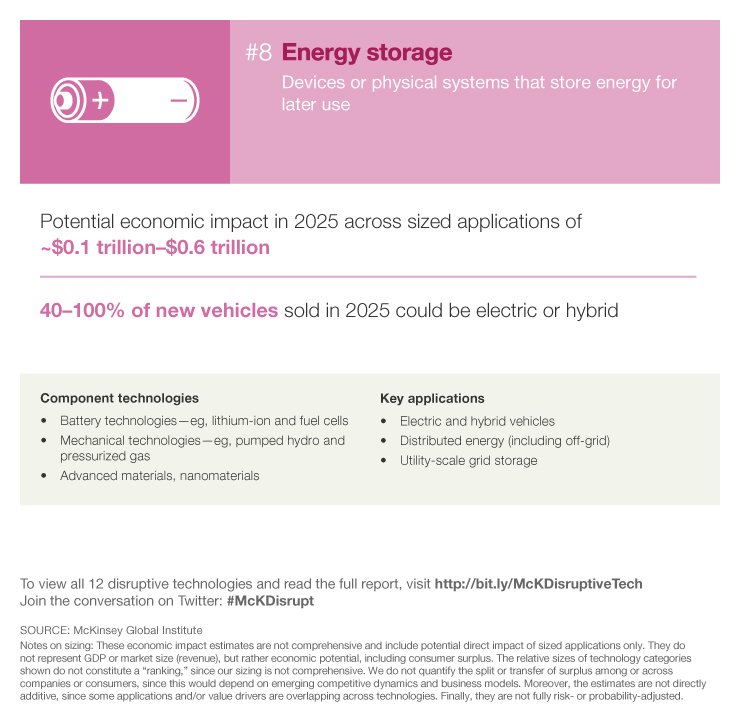
McKinsey: Disruptive Tech
Slide series for McKinsey illustrating the projected 2025 impact of 12 disruptive technologies. Designed to translate complex economic data into clear, engaging visuals using iconography, color, and concise layouts. Each slide highlights key technologies, applications, and potential value.


McKinsey: Education to Employment
Tall-format infographic distilling the report’s three transition points—enrolling, building skills, and finding a job—with simple charts and callouts that guide the story.
McKinsey: M&A Markets
Interpretive tool UI showing investor views on deal value added (DVA) and overpayment (POP), with filters to compare by industry, geography, or funding source.
McKinsey: Mobile Branding
A cohesive family of McKinsey app icons using a shared type system and color strategy.
Selected — Wordmark

Variant — Monogram
